
I Built the Graph. Then It Drew Itself.
The thing I wanted to know was simple. Which files in my knowledge base actually get used together? Not "which files mention the same person" (the entity pipeline answers that) and not "which files are about similar topics" (vector search answers that). I wanted to know which files travel as a pair through my real workflow, even when they share no words, no topic, no obvious link.
The hypothesis was that the strongest connections in a knowledge base aren't in the content. They're in the behavior. A planning document and a contact card might never mention each other and still belong together because I open them every Monday morning in the same session. Content analysis can't see that. Behavior can.
So I built a filesystem layer to watch the accesses. I Put a Filesystem in the Middle of Everything tells that story. It worked, mostly. But it ended with a problem: the filesystem could see what files were being opened, not why. Claude Code, the agent doing most of the reading, spawns a new subprocess for every tool call. From the filesystem's perspective, a hundred deliberate Reads from one conversation looked like a hundred unrelated single-file accesses. Behavior, but no reasoning.
I needed two layers, not one. This post is what happened when I added the second.
The merge
The other layer was already there. I'd built an audit framework that logs every tool call from Claude Code, the PKB, and the personal assistant to JSONL. Each row carries a trace_id (the conversation ID), the tool name (Read, Edit, Grep, Glob), the file path, and a timestamp. That's the cognitive layer. Not what processes touched what files, but what the agent was thinking about when it touched them.
The FUSE layer captures behavior at the filesystem level: opens, reads, writes, stats, readdirs. Every file access by every program, regardless of intent.
With both layers feeding the same graph, edges get a provenance tag (fuse, audit, or both) and a tool breakdown (Read:12+Edit:10+Write:2). The merge matches a FUSE session and an audit session where 30 percent or more of the files overlap, and the audit log wins ties because it knows the difference between Read and Grep.
The first time I ran the merged analysis on two days of data, the count of "real" edges jumped from five to fifteen. Promising, but two days is two days. I let it run. Six days in, the merge produced thirty-four edges. A couple of weeks in, the pattern had held. That was when I trusted the design. The filesystem could see what happened. The audit log could see what was meant. Neither alone was enough. Together they covered both.
The decay
Edges should fade. A pair I haven't opened together in three months is a worse signal than one I opened together yesterday. That much was obvious. But "fade" couldn't mean "delete." If I came back to an old project after six months, the system should still remember it was a cluster. The interesting question wasn't whether to decay. It was how.
I was sketching it out one evening and the connection landed: this is how memory works in the brain. Neurons that fire together strengthen the connection between them. Unused synapses weaken but don't disappear. Recall an old skill after years away and the wiring is still there, faded but findable. Hebbian co-activation is the model the brain has been running for a few hundred million years, and someone had already done the math for it.
The formula came out simple:
strength = lifetime_day_count * 0.5^(days_since_last_seen / 30)
The lifetime_day_count is permanent. It records how many distinct days a pair was co-accessed, ever. Only the recency multiplier shrinks. Open the pair again and the multiplier snaps back to 1.0, the day count bumps, and the edge is at full strength. In real brains the re-strengthening is gradual, not a step function. This is a simplification. Close enough for one person's file accesses.
This shows up concretely. Three family-history edges (the README, family-tree.org, and mansson-family.org) sat unread for nineteen days but stayed above the inclusion threshold. They were strong enough from past sessions to outlast nineteen days of neglect. They'll drop below the threshold around day forty-nine if I don't revisit them, but the underlying data persists. Pick up the thread next year and the cluster is still there waiting.
Long-term memory that fades gracefully but never forgets.
Three signals, and where they disagree
The graph now has three independent edge sources. Each one captures something the others can't.
| Signal | What it captures | Source |
|---|---|---|
| Semantic similarity | "About similar things" | BM25 + vector search |
| Entity extraction | "Mention the same people or projects" | Mem0 entity pipeline |
| Behavioral co-access | "Used together in practice" | FUSE + audit logs |
The interesting cases are the ones where the signals disagree.
Two files can be semantically unrelated but behaviorally tightly coupled because they serve the same workflow. A planning document and a person's contact card never mention each other, but they're opened in the same session every Monday morning. Content analysis can't see that. Behavior can.
Two files can be about the same topic but never used together because one is stale. Content analysis will return both. Behavior will tell you which one matters today.
The combination is where the value lives, not any single signal.
The clusters drew themselves
Twelve weeks in, I ran cluster detection on the full graph. Eleven clusters surfaced. I didn't design any of them.
The work-planning cluster is the tightest. planning-dossier.org and the oneapp-migration README at strength 12.47, alive across fourteen distinct days, seventeen sessions, last touched five days ago. Add weekly-cadence.org at strength 9.41 and the picture is clear: this is the cluster I sit in every Monday and Friday. The system found my work rhythm by watching the files I open together.
There's a finance cluster. investments.org, nordnet-trading.org, notes.org. Three files, dense as anything in the graph: average 15.7 sessions per pair, the densest cluster in the whole system. Of course it is. I check my portfolio more often than I'd admit in these uncertain times.
There's a people cluster: sixty members, ninety-one internal edges. Alyn, Daphne, Fredrik, Nathan, Rosamia, Sedrik, the weekly sync notes for Daphne, the planning dossier, the project READMEs they show up in. Daphne is the example that first taught me the system worked. Her contact card doesn't mention the project oneapp-migration anywhere in its content. They're connected because I open them together every week. The graph sees a relationship that the words on the page can't.
But the cluster I want to point at is the blog/writing one. Thirty-nine members. The blog README, blog-ideas.org, the FUSE post notes, the data-constitution post notes, the validators draft that became "Error Budgets, Not Validators," the draft of "The Model I Trusted Broke First." The system is tracking the writing of the posts about itself. The current post, the one you're reading, is in there too. By the time it's published, the file you're seeing rendered will already be a node with edges to half a dozen other files in that cluster. The graph is recursive.
There's a support-cases cluster as well. Seven group-milestone tickets and the design doc that emerged from them. I wrote a blog idea last month about how those tickets, once written down and categorized, collapsed from "infinite variety" into a small taxonomy. The graph is showing me the same pattern from below: the files cluster because I work them together. The taxonomy I spotted in my head is visible in the access pattern.
I didn't ask for any of this. The clusters reflect how I actually work. They didn't exist when I started and I never wrote them down. They emerged from twelve weeks of file accesses, decayed by a Hebbian rule, surfaced by a clustering algorithm that doesn't know what any of these files are about.
(I also just wanted to build it. The thought of a force-directed graph of my own knowledge base was exciting in the way only a side project can be.)
The surface
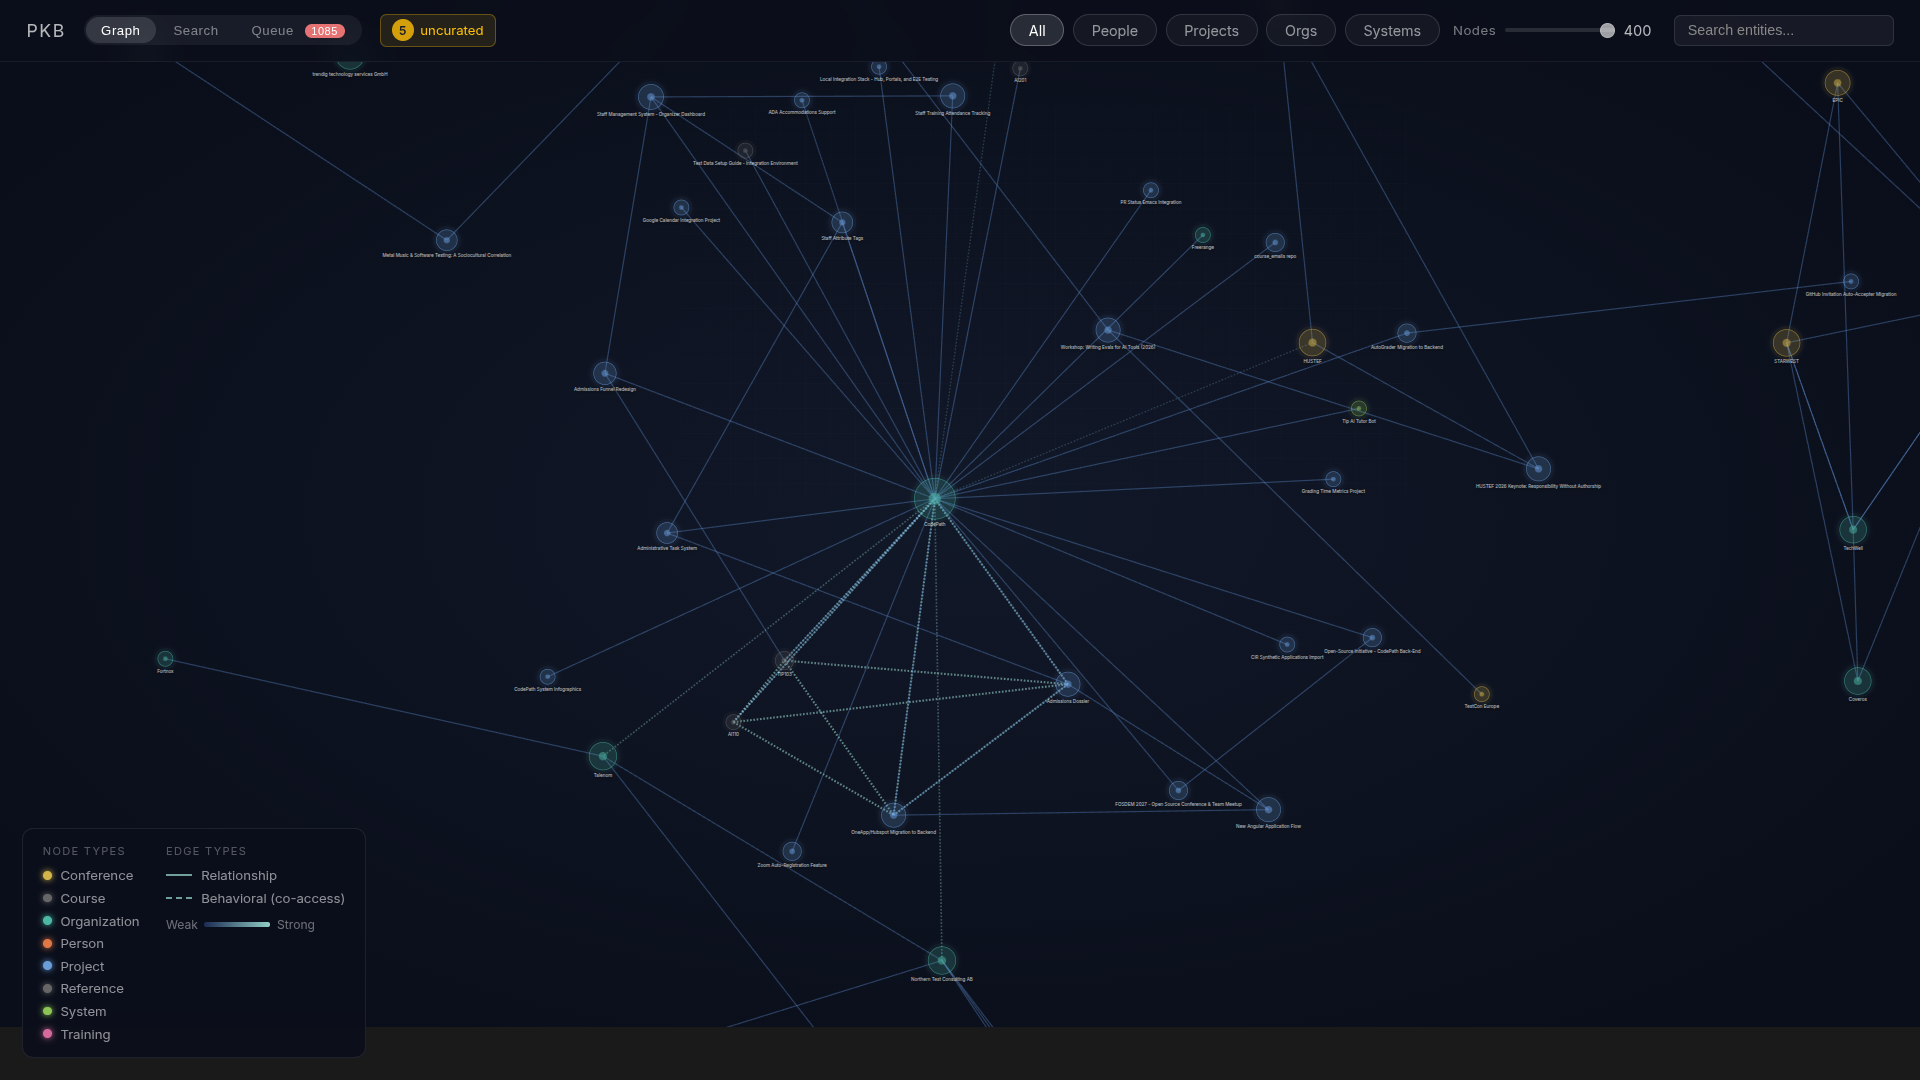
The graph needed a viewer. I built one (D3.js, force-directed layout, color-coded by entity type, dashed lines for behavioral edges, solid lines for content edges). That was the original plan. Make the graph visible.
What happened next was that the viewer became the editor. Then it became the entity browser, the document reader, the place I do consolidation review, the place I launch projects into Claude Code from. The graph was the substrate. The UI became the surface. That's a separate post.
What it's for
The point of all of this is retrieval. Behavioral edges feed back into search ranking for my Personal Knowledge Base (PKB), so the first result for "the planning conversation with Daphne" is the document I'd actually pull up, not the one with the most keyword matches. That matters more than it used to. Every iteration an AI agent has to do because the first answer was wrong is tokens spent. Pre-computing the structure from behavior moves that work out of query time and into background batch jobs. It's the same pattern this series has been circling: move intelligence from runtime to build-time, keep human judgment for the final call.
Twelve weeks later
The numbers, current as of last night: 4,697 edges total, 300 still active, 4,397 decaying. Eleven clusters. 388 entities across thirteen types. The growth curve has a single visible inflection point: the week FUSE went live. Six new edges the week before. Seven hundred and eleven the week after. The system started learning about itself the moment it could observe itself.
No one curated any of this. The clusters emerged from how I actually use the system. The strongest edge is between two files I haven't explicitly linked. The densest cluster is the one I'd be most embarrassed to admit I look at the most. The cluster I'm most proud of (the blog one) contains this file.
The architectural lesson from this whole series, the one I keep landing on: the value isn't in any single algorithm. It's in the substrate. Build a system that observes the right things, give it ways to remember and to forget, and let the structure emerge from use. The graph is what happens when you do that and wait.
Next post: keeping the graph honest as the world shifts. The system that emerged is alive, which means it also drifts.


